
The first mistake in metals analysis is treating "the metals" as a single trade. Gold is bought by central banks as a reserve asset. Silver is bought by solar-panel manufacturers. Platinum is pulled out of a South African shaft. Palladium is a by-product of Russian nickel. Copper is wired into every data centre and EV on earth. Same asset class on a screen — completely different engines underneath.
Group them correctly and the picture clears. Two buckets, one benchmark:
- Monetary / safe-haven: gold and silver — driven by real rates, geopolitics, and (for silver) industrial demand.
- Industrial / supply-driven: platinum, palladium and copper — driven by concentrated mine supply, end-use demand, and the energy transition.
Gold — the benchmark and the diversifier
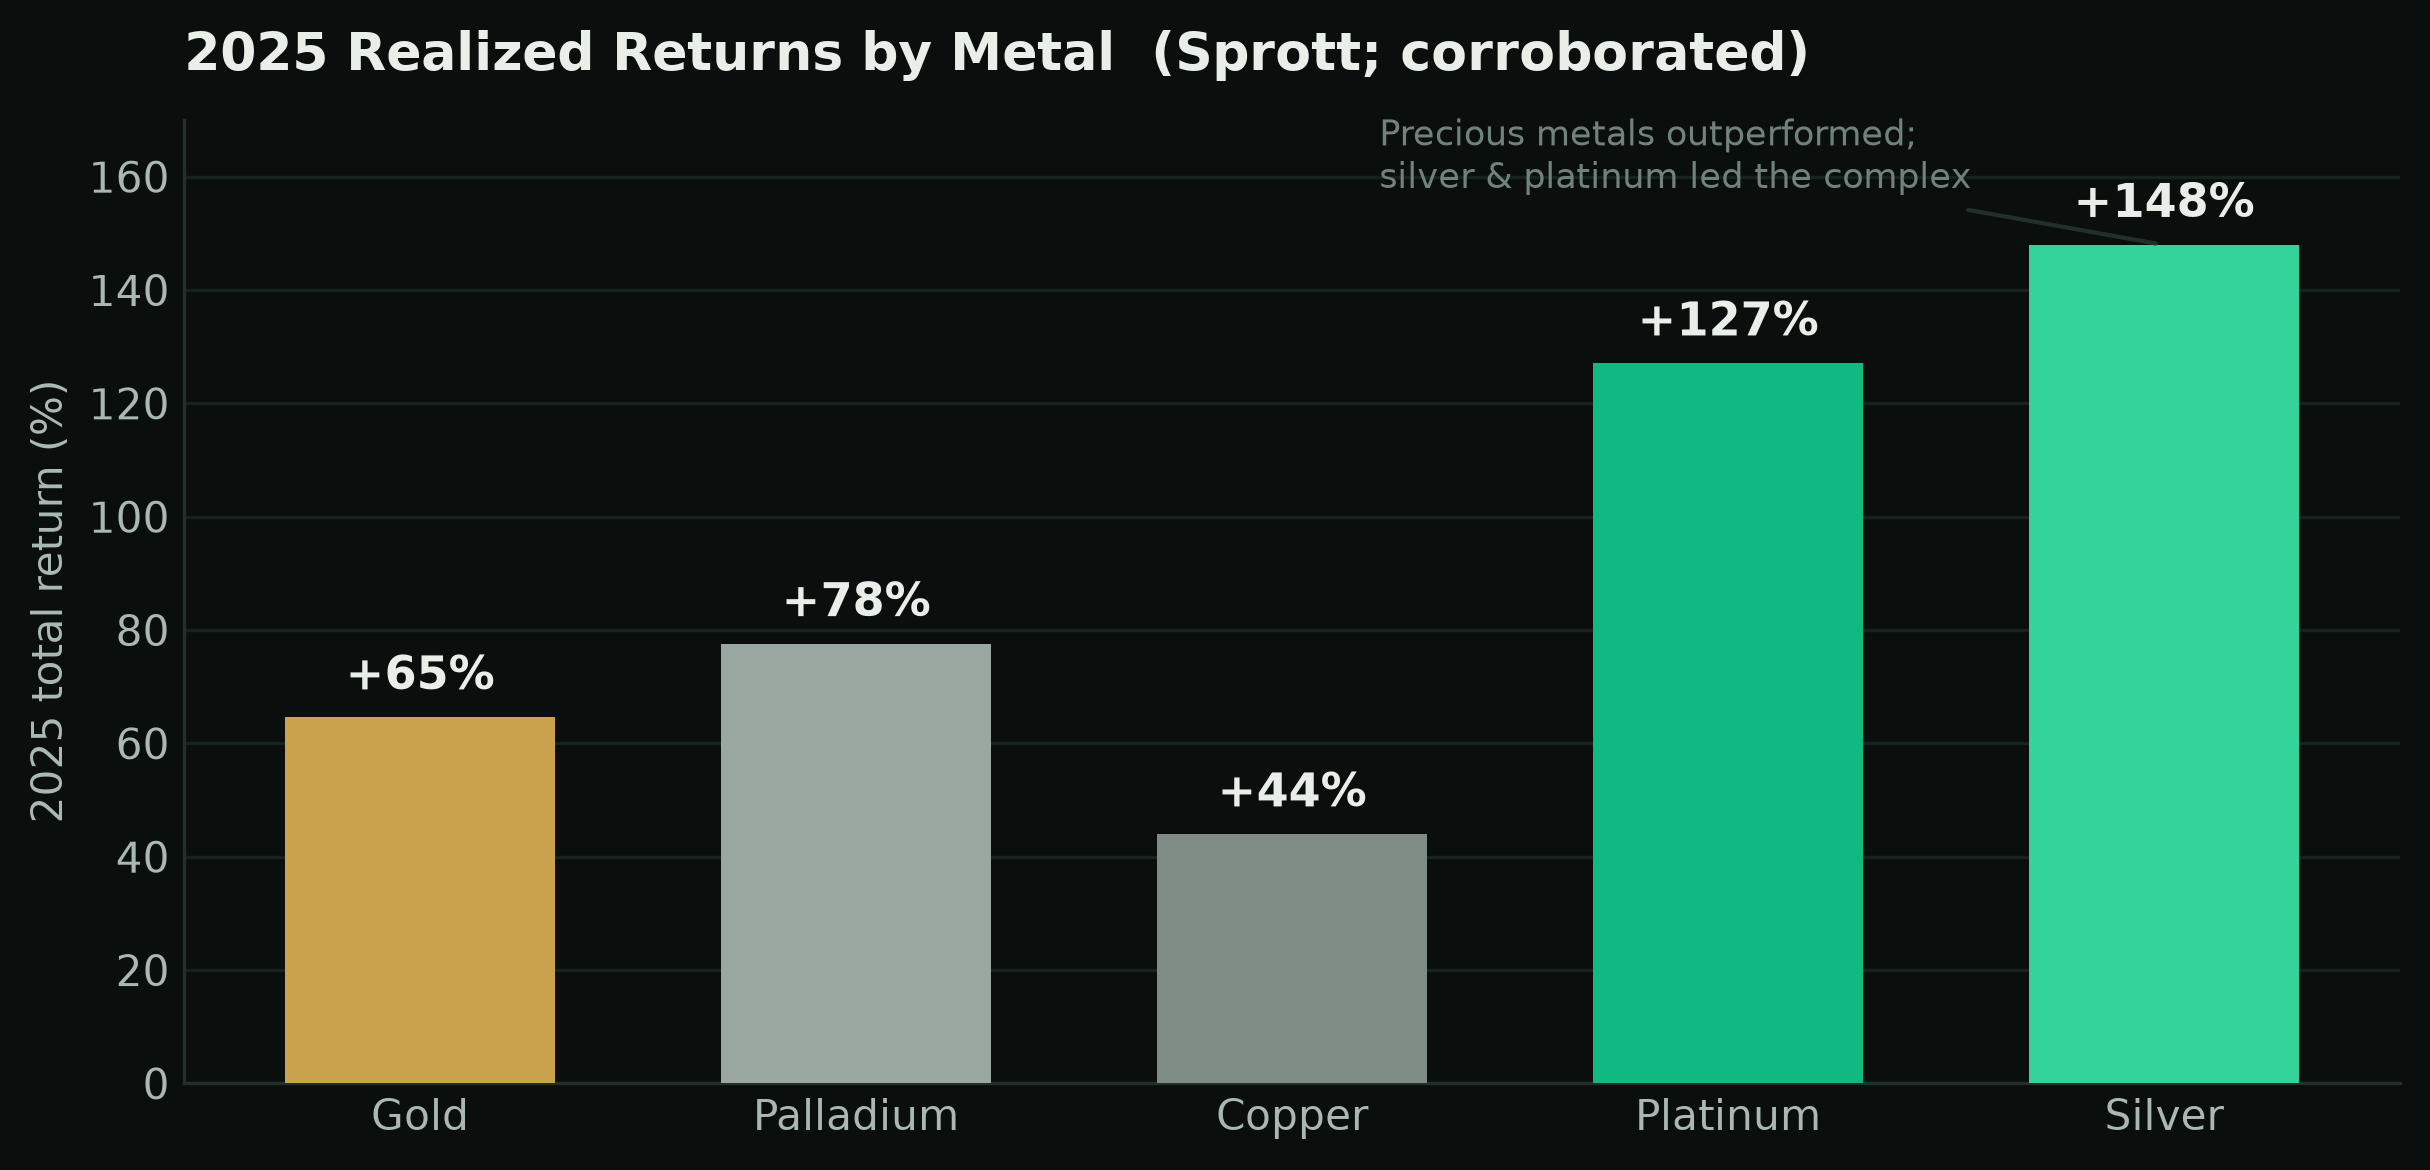
Gold is the only metal with a durable monetary bid, so it is the reference asset everything else is measured against. Its 2025 return was ~+65% (Sprott), with record highs above $4,000/oz.
| Driver | Direction | Why it matters | Status (2025–26) |
|---|---|---|---|
| Central-bank buying | ↑ Price | >20% of global demand since 2022 (vs ~10% in the 2010s); Turkey, India, China lead | Structural, price-insensitive |
| Real-rate correlation | Broken | Inverse link to real US yields snapped after Russia's 2022 invasion → a geopolitical bid | Decoupled since 2022 |
| Fiscal / debt fears | ↑ Price | US Treasury swap spreads, deficit worries, de-dollarization chatter | Active support |
| Geopolitical hedging | ↑ Price | Sanctions risk drives EM reserves into gold | Elevated |
LBMA's 2026 survey puts gold's average forecast near $4,742/oz, with bulls eyeing $6,000–$7,000 — citing continued official-sector buying, fiscal stress, and a weaker dollar.
Silver — high-beta gold with an industrial engine
Silver is ~55%+ industrial demand (solar, EV electronics, AI infrastructure) but still trades with gold (1-yr correlation 0.68–0.95). Net result: a leveraged, more cyclical version of gold. 2025 return ~+148%.
| Driver | Direction | Why it matters | Status |
|---|---|---|---|
| Industrial demand | ↑ Price | Record solar/EV/grid offtake; 5th consecutive annual deficit (2025 ~117Moz) | Structurally bullish |
| Above-ground stocks | ↓ Price | Large inventories have absorbed deficits, blunting the price response | Cap on upside |
| Investment flows | Mixed | Underperforms gold in risk-off (industrial DNA → China/growth caution) | Cautious |
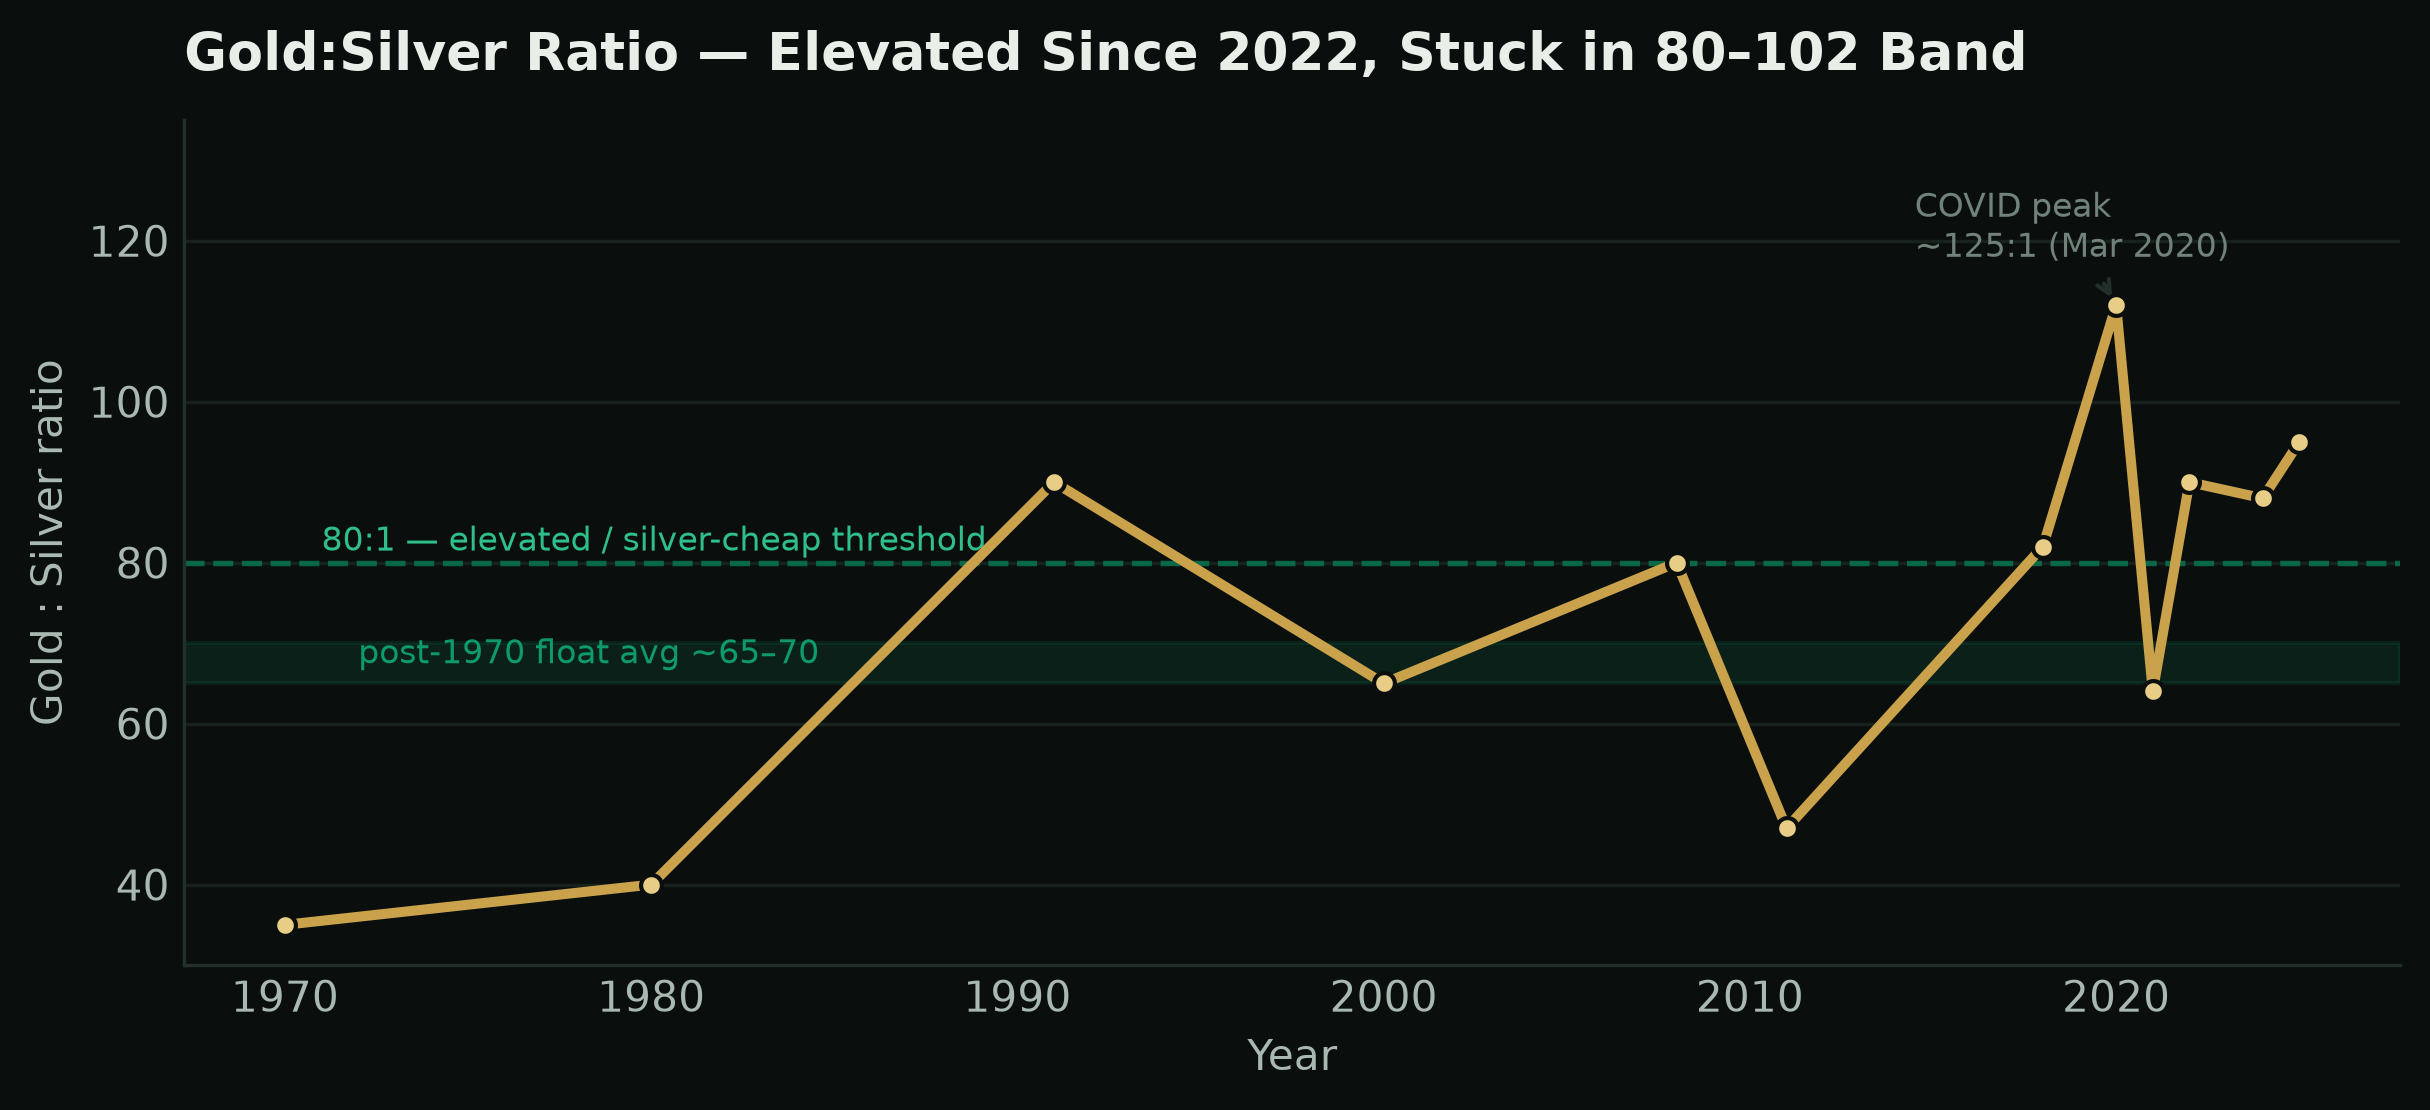
| Ratio reversion | ↑ Silver | At 80–102, silver looks cheap vs gold by history | Mean-reversion case |
The gold:silver ratio is the cleanest expression of the silver view: accumulate silver (or long-silver / short-gold) when the ratio is above 85; favour gold below ~65. Best as a multi-year, not tactical, position.
Platinum — the supply-constrained PGM
The most industrially-exposed precious metal (43% autocatalyst, ~21% other industrial, ~24% jewelry). 2025 return ~+127%. The story is a structural supply deficit underpinned by South African concentration.
| Driver | Direction | Why it matters | Status |
|---|---|---|---|
| SA mine supply | ↑ Price | ~72% of output from Bushveld; power/labour disruptions chronic (Apr-25 SA PGM output -24% YoY) | Persistent risk |
| Market deficit | ↑ Price | 4th consecutive deficit forecast 2026 (~297k oz, WPIC); stocks ~5 months of cover | Tight to 2030 |
| Lease rates | ↑ Price | Jumped from ~1% (2024) to 12–22% (2025): a physical-scarcity signal | Elevated |
| Hydrogen + jewelry | ↑ Price | Fuel-cell demand +35%/yr; China/India jewelry growth | Multi-yr tailwind |
LBMA 2026: platinum average forecast ~$2,222/oz (bulls >$3,000). WPIC sees deficits averaging ~330k oz through 2030 — the tightest structural setup in the complex.
Palladium — the high-risk PGM pure-play
The most single-variable metal: >80% of demand is autocatalyst, >75% of supply is Russia+SA (Nornickel ~40% alone). 2025 return ~+78% on a supply squeeze — but the forward setup is the most two-sided in the complex.
| Driver | Direction | Why it matters | Status |
|---|---|---|---|
| Russia+SA supply | ↑ Price | Sanction/logistics risk on >75% of output | Geopolitical premium |
| EV substitution | ↓ Price | ICE decline → WPIC forecasts surplus from 2027 (~897k oz by 2027) | Structural headwind |
| PGM substitution | Pairs w/ plat | Autocatalyst swap to platinum when palladium rich; bounds the spread | Self-limiting |
| 2025 squeeze | ↑ Price | Slowing EV adoption + RU-reliability fears drove the +78% rally | Already priced? |
Palladium is a tactical, event-driven trade — long on Russian-supply shocks, short on EV-acceleration / surplus confirmation. Do not own it as a passive core position.
Copper — the industrial bellwether
Copper does not trade as a haven — it trades global growth and the energy transition. 2025 return ~+44% at ~$10,000/t. It is the odd one out: it rises on growth, not fear.
| Driver | Direction | Why it matters | Status |
|---|---|---|---|
| China demand | ↑ Price | ~40%+ of demand, 57% of refining; infrastructure + green stimulus | Policy-driven |
| Energy transition | ↑ Price | EVs use 4x the copper of ICE; grid/solar/data-centres; BMI sees $17k/t by 2034 | Structural bull |
| Mine supply | ↑ Price | Growth ~2.3% (2025) vs 4–5% needed; grade decline, 16-yr timelines | Chronic tightness |
| 2026 balance | Near-flat | ICSG: ~150k t deficit 2026 (from surplus) on slower output; long-run deficit | Balanced near-term |
Copper is a growth beta and a long-duration energy-transition play, not a hedge. Size it as you would an industrial-equity exposure, not a safe-haven allocation.
Where the asymmetry sits
Mapping the research to action — and to the instruments that express each view:
| View | Expression | Rationale | Primary risk |
|---|---|---|---|
| Core diversifier | Gold (ETF / futures / physical) | Monetary bid + CB buying; portfolio hedge | Real-rate / dollar rebound |
| Ratio reversion | Silver overweight vs gold | Gold:Ag 80–102 vs 65–70 avg; structural deficits | Stocks cap upside; China slow |
| Supply squeeze | Platinum (long) | SA deficits to 2030; elevated lease rates | Substitution to palladium; SA ramp |
| PGM spread | Long plat / short pall | Substitution + palladium surplus trend from 2027 | Russian supply shock lifts palladium |
| Growth beta | Copper (long, sized) | Energy-transition structural deficit | China slowdown; mine ramp |
| Tactical only | Palladium (event-driven) | Squeeze potential vs surplus thesis | Two-sided; avoid as core |
Instrument map. Futures (CME/COMEX): GC, SI, PL, PA, HG — deep liquidity, ~25x margin on gold vs ~2x for ETFs, 24/7 gold (1OZ) available, frictionless short side. ETFs: GLD/IAU, SLV, PPLT, PALL; copper via CPER or miners. Ratio/spread trades are best executed as paired futures to isolate the relative-value view and cut directional beta.
Risks & data notes
- Forecast dispersion. LBMA 2026 gold forecasts span ~$3,450 (low) to $7,000 (bull). Treat all forecast figures as scenarios, not point estimates.
- Price-source inconsistency. Public 2025 price series disagree on absolute year-end prints; this article anchors on Sprott's corroborated returns and LBMA averages.
- Leverage. Futures amplify gains and losses; a 25x margin position can be wiped out by a 4% adverse move.
- Geopolitics. SA power/labour shocks (platinum) and Russian sanctions (palladium) can move prices 10–20% in days — both ways.
- Not advice. Educational research only. Consult a licensed advisor; BERUBE CAPITAL does not solicit retail via this document.
Sources: World Gold Council; LBMA 2026 Forecast Surveys; World Platinum Investment Council; Silver Institute World Silver Survey; CME Group; ICSG; Sprott; Reuters, Kitco, Mining.com, INN, Crux Investor, Morgan Stanley, ECB. Returns are 2025 calendar-year totals; other prices are published averages or analyst survey means.